Markov One: visualizing stochastic flows in the browser
web
Markov One is an interactive web application for exploring flow through two-dimensional meshes. It combines precomputed simulation data with a Monte Carlo solver that runs directly in the browser.
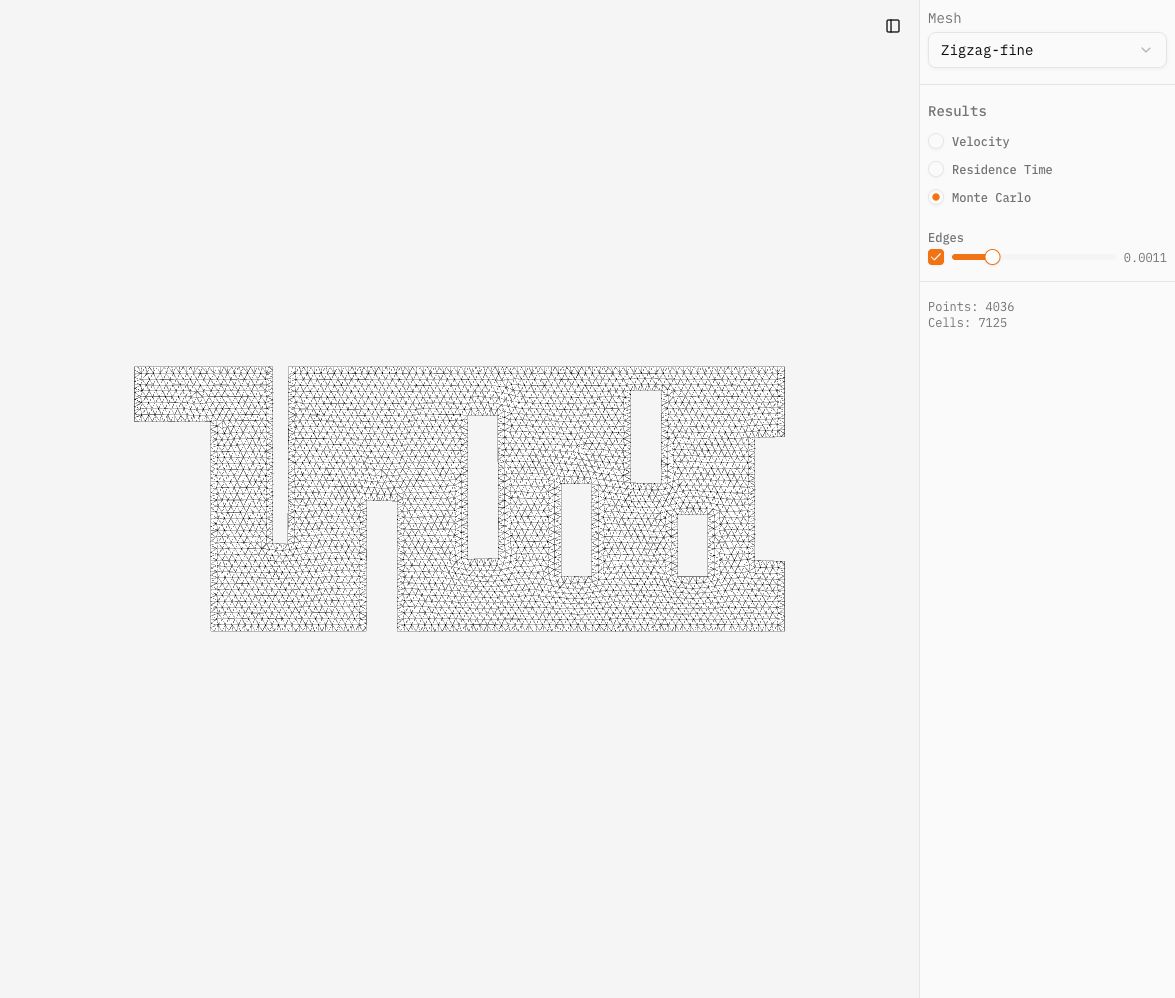
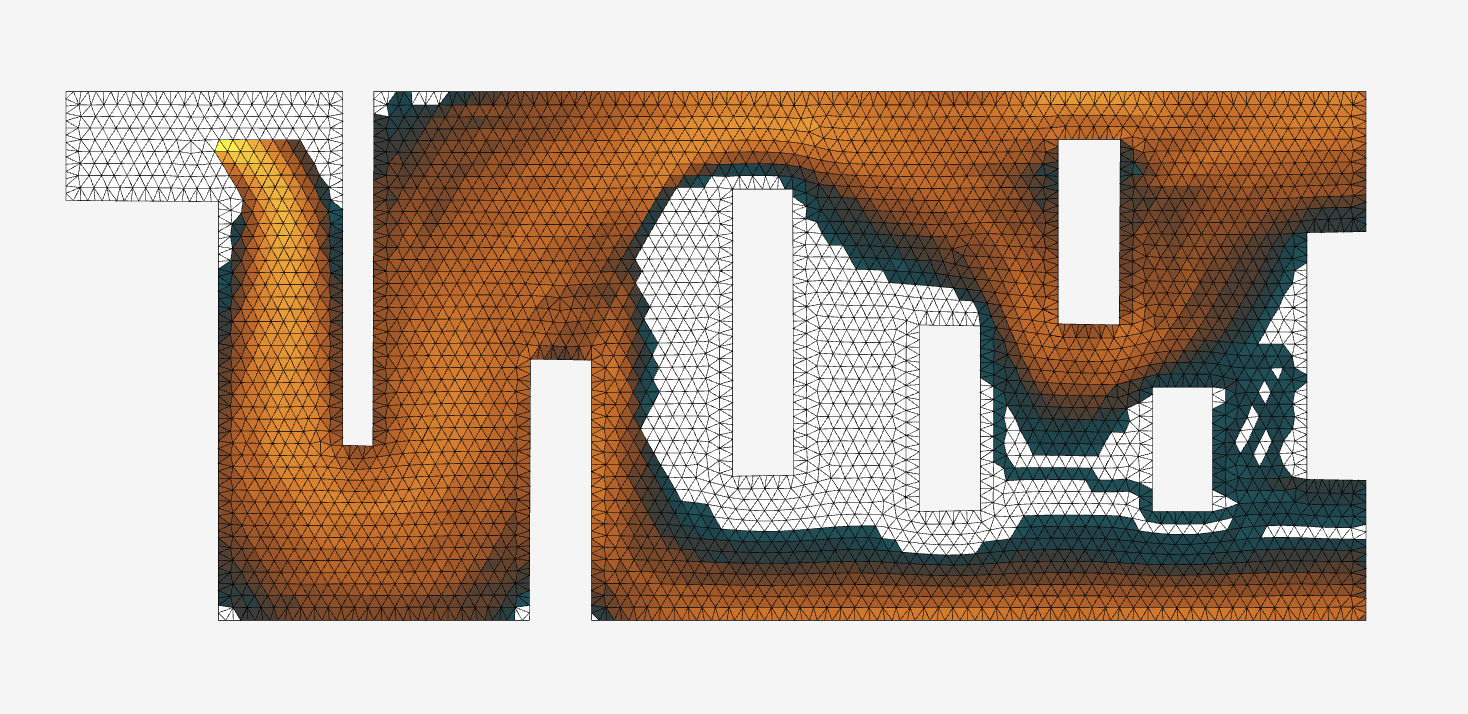
The interface starts with an uncolored mesh. Selecting a cell launches a set of weighted random walks and reveals the regions those trajectories are likely to visit.
Project overview
Each geometry is stored as a JSON dataset containing:
- mesh points, cells, and centroids
- a directed graph with transition probabilities
- residence-time and velocity data
- inlet and outlet definitions
The default zigzag-fine dataset contains 4,036 points and 7,125 triangular cells. The application can display Monte Carlo probabilities, residence time, or velocity. Users can also switch geometries and adjust the mesh rendering from the sidebar.
The project is intentionally self-contained. The datasets are bundled with the application, so changing a view or running the solver does not require an external API.
Stack and tools
| Technology | Role |
|---|---|
| Next.js 15 | App Router, server-side data loading, and deployment structure |
| React 19 and TypeScript | Interactive components, state, and typed data flow |
| SVG | Rendering thousands of mesh cells and vector overlays |
| Graphology | Directed weighted graph representation |
| D3 | Logarithmic color scales and vector sizing |
| Zod | Runtime validation of the simulation datasets |
| Tailwind CSS and shadcn/ui | Layout, controls, and sidebar components |
| Radix UI | Accessible control primitives |
| Vercel | Hosting and deployment |
How the application works
The Next.js page loads the selected JSON file on the server and validates it with Zod. The typed result is passed to the client-side visualizer, which converts the serialized graph into a Graphology instance.
Every mesh cell becomes a native SVG <polygon>. A lookup connects each polygon to its corresponding graph node, allowing a pointer interaction on the visualization to become a solver starting point.
The frontend uses two small React contexts:
ControlsProviderstores the active result type and display settings.ResultsProviderstores mesh information and Monte Carlo probabilities.
This keeps the visualizer and sidebar synchronized without introducing a larger state-management library.
The Monte Carlo solver
When a cell is selected, the solver runs 1,000 random trajectories from its graph node. At every step, outgoing edge weights are normalized into probabilities and one neighboring node is sampled. A trajectory stops when it reaches an outlet, a dead end, or the configured time horizon.
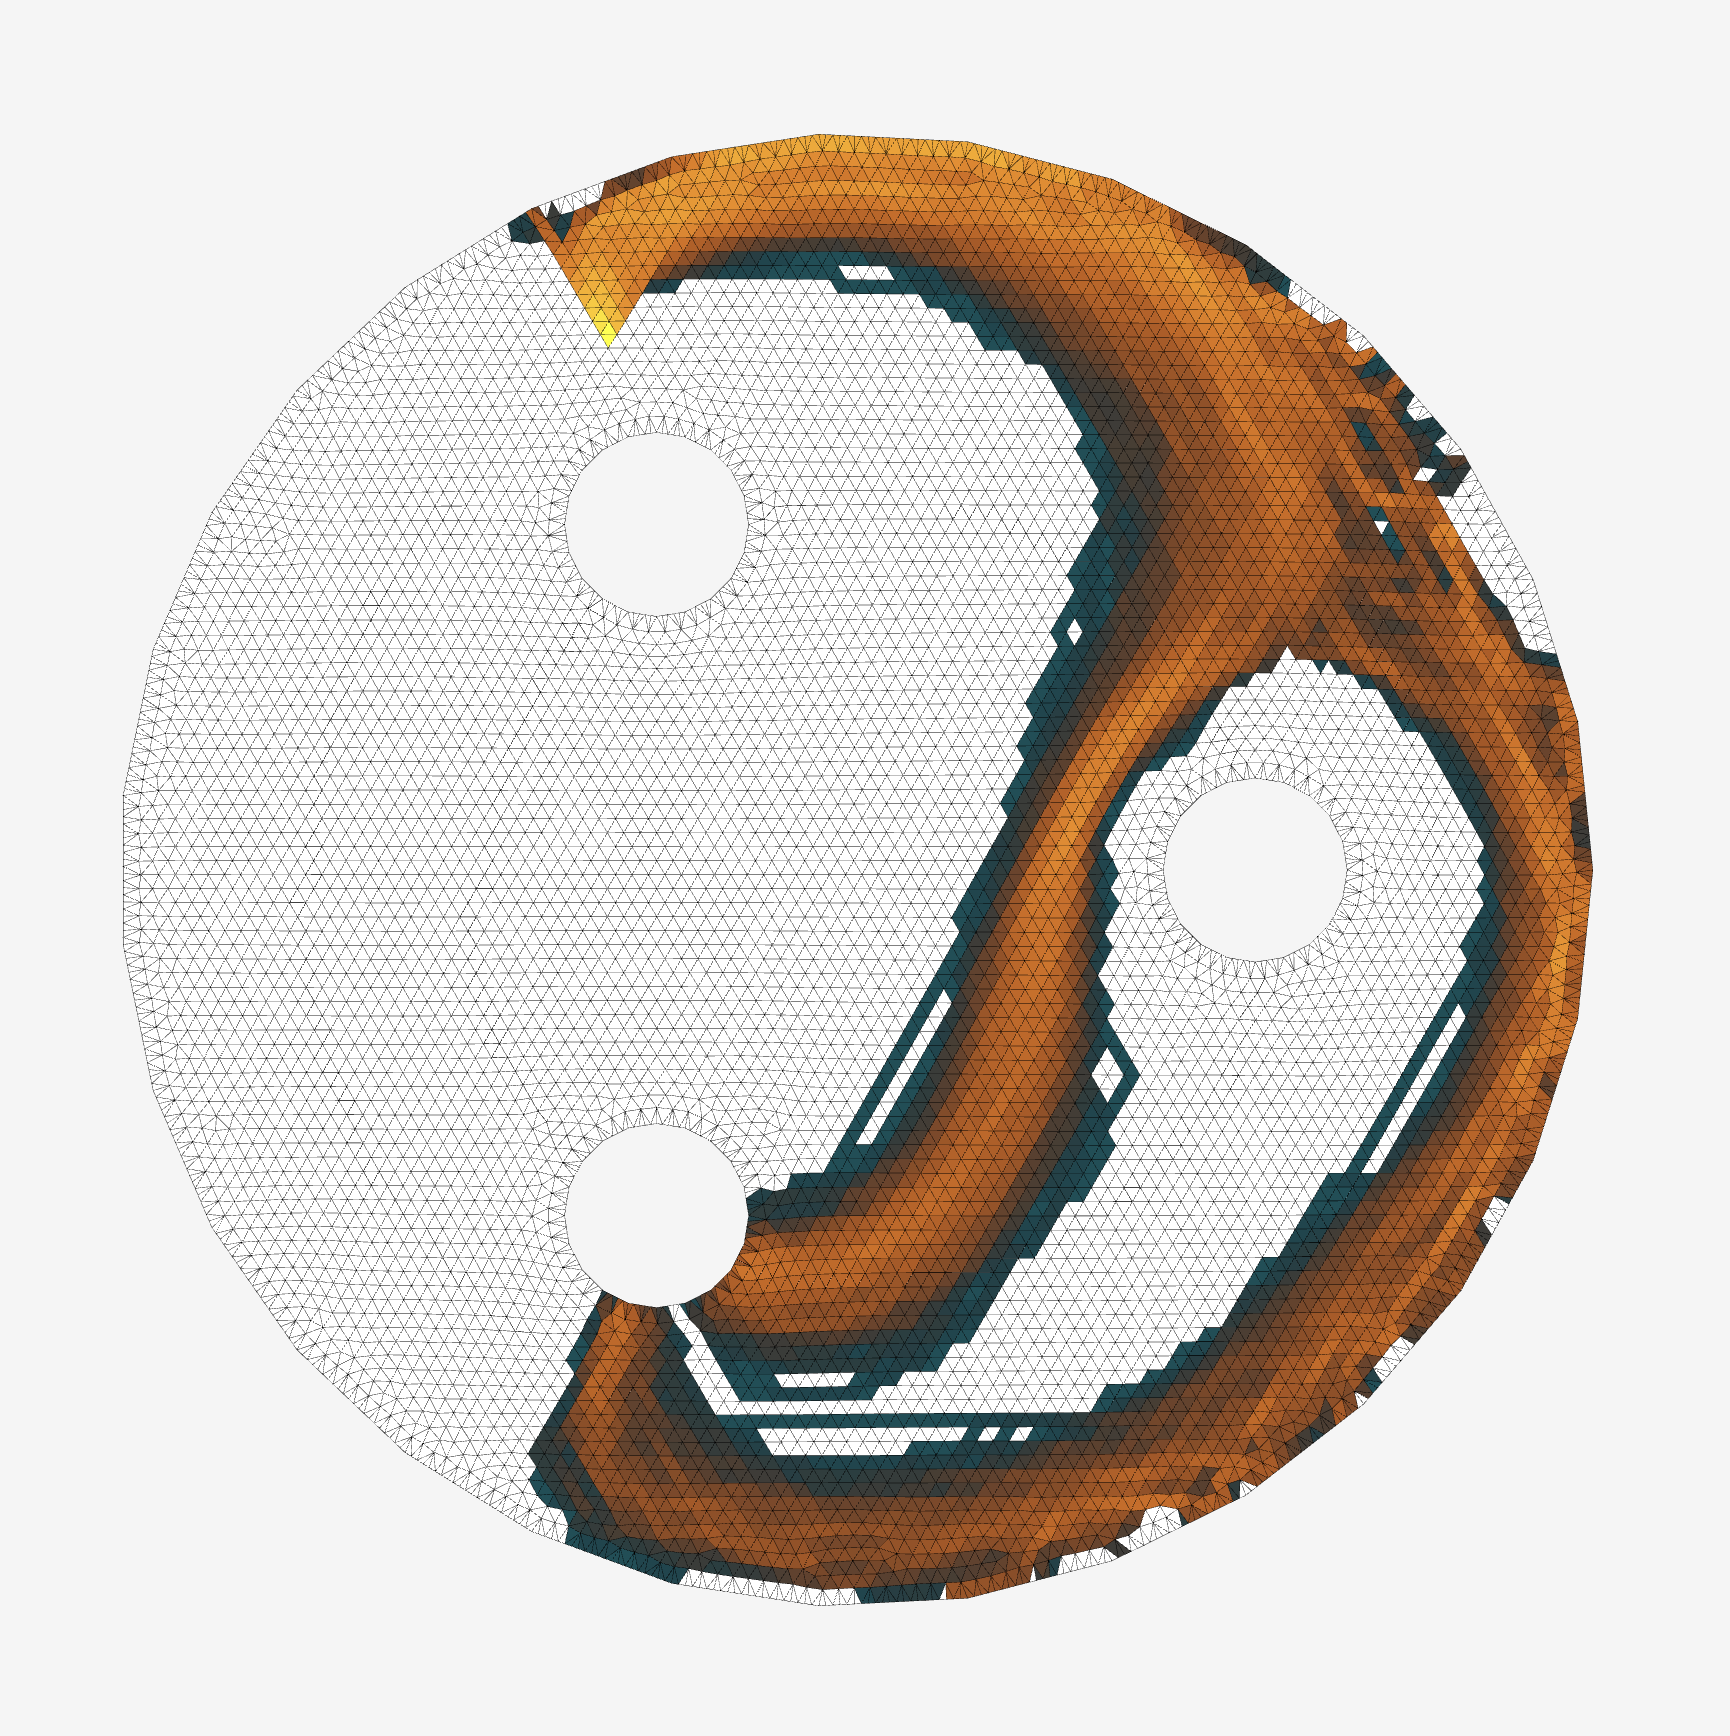
Each trajectory records which nodes it visited. The final value for a cell is the proportion of trajectories that visited it at least once. The result is therefore a finite-horizon visit-probability map, rather than a stationary distribution or a count of repeated visits.
The resulting values are stored in React state and mapped through a logarithmic D3 color scale. Unvisited cells remain white, while probable paths move from deep green through orange to yellow.
Frontend approach
Native SVG is a good fit for this project because the simulation geometry already consists of polygons, lines, and vectors. It keeps the rendering model close to the source data and makes individual cells directly interactive and inspectable.
The same mesh component supports three visual layers:
- Monte Carlo visit probabilities computed in the browser
- residence-time values loaded from the dataset
- velocity magnitudes with an optional quiver overlay
Graph construction and cell-to-node mapping are memoized, while the sidebar exposes only the controls relevant to the selected view. The coordinate system is flipped at the SVG level so the simulation can retain its conventional positive-Y-up coordinates.
Project outcome
Markov One demonstrates how a numerical model can become an understandable interactive tool with a relatively small frontend architecture. The main challenge was connecting four representations cleanly: serialized simulation data, a weighted graph, React state, and an SVG heatmap.
The current version works well as an exploratory visualization and portfolio project. Natural next steps would be moving larger solver runs into a Web Worker, adding a color legend and selected-cell marker, and using seeded randomness for reproducible results.